
The client report: six areas of daily life at a glance
Sensors in a client's home collect a lot of data. The new report in the Community Portal turns that data into something a care professional can act on. It brings sleep, safety, hygiene, mobility, nutrition and social contact together on one page. For each area it compares the last few days with the client's own usual pattern, and it flags the changes that are worth a conversation.
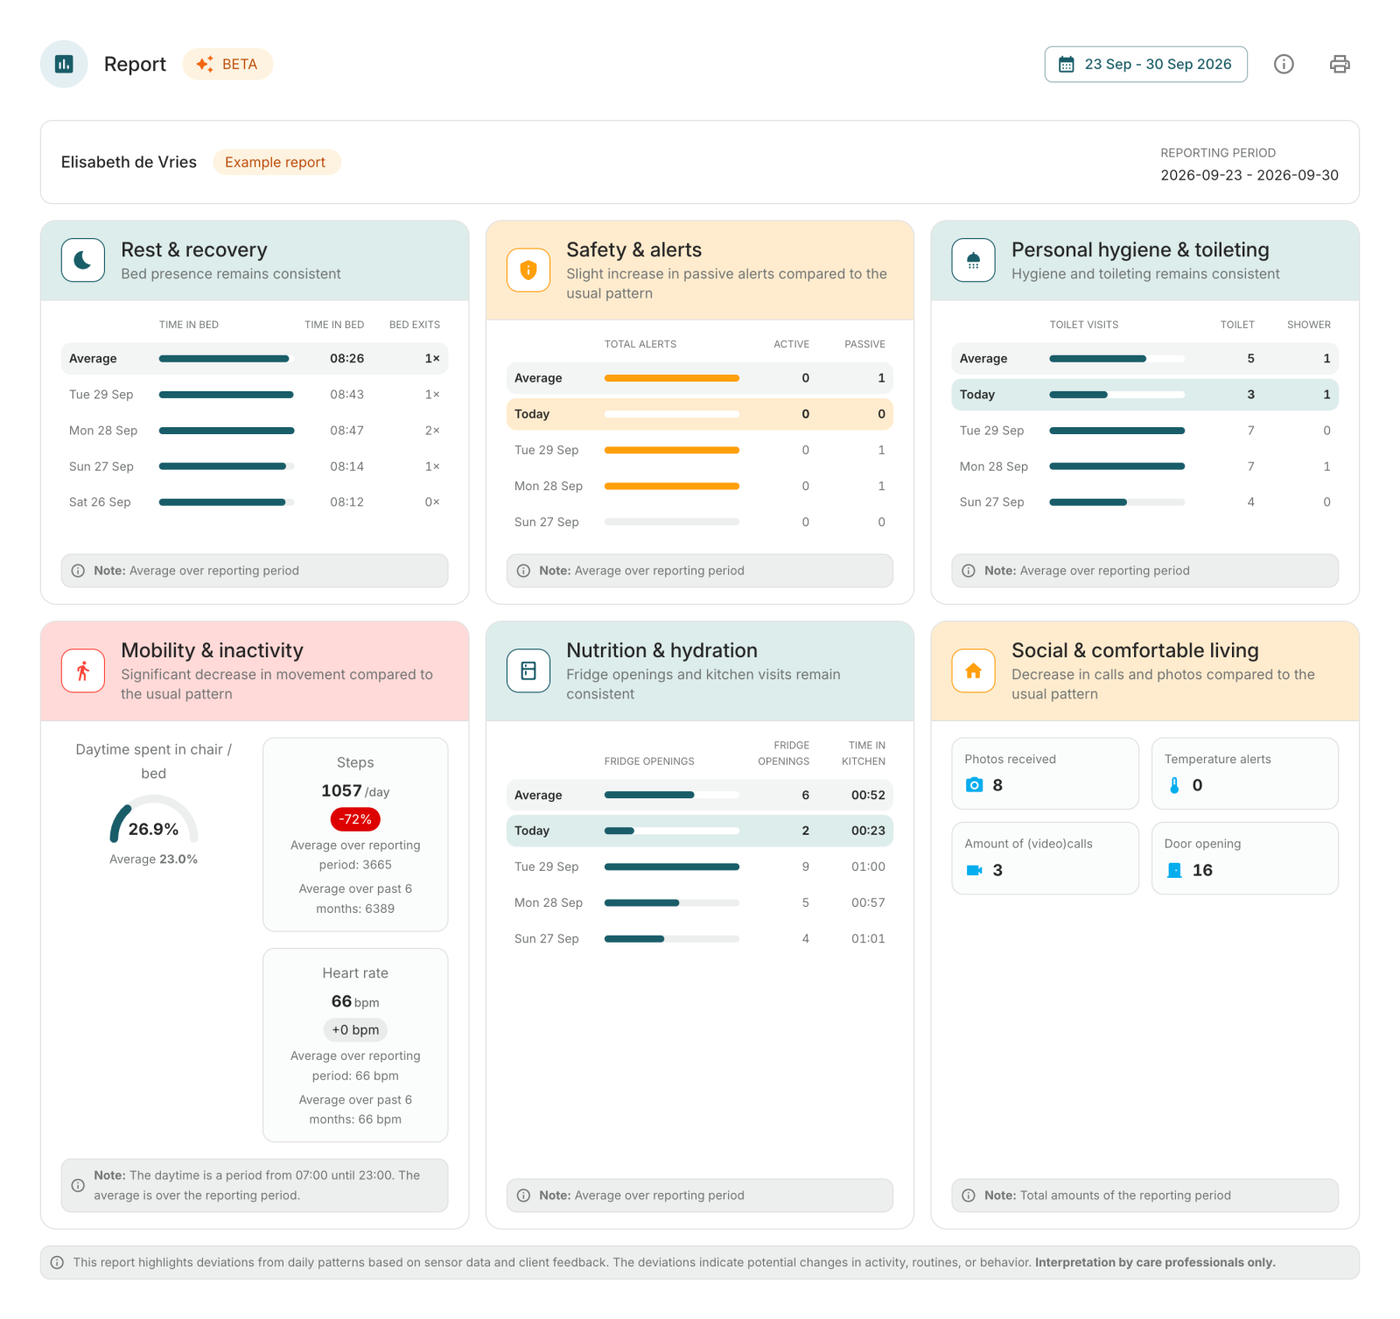
The report is in beta. It highlights deviations from daily patterns, and the interpretation is always up to a care professional.
Finding and reading the report
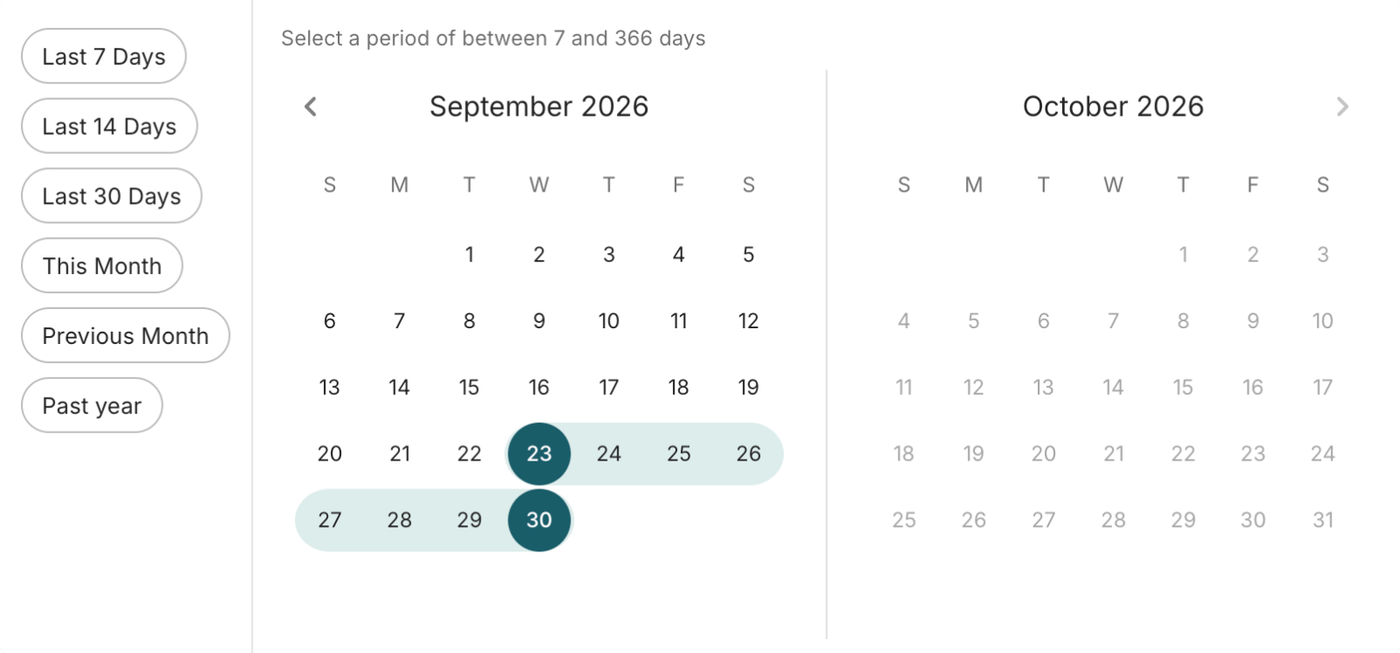
Open a client in the Community Portal. The report is the block below the client's trends. At the top you choose the period to report on: the last week by default, or any period of between 7 and 366 days. Shortcuts cover the last 7, 14 or 30 days, this month and the previous month.
The report consists of six blocks, one for each area of daily life. Every block works the same way:
- The rows show the average over the selected period, followed by the most recent days.
- The headline under the block title is the most important finding.
- The colour tells you how much attention the finding deserves:
- Teal: Nothing notable: the recent days match the usual pattern
- Orange: A slight deviation from the usual pattern
- Red: A significant deviation from the usual pattern
Findings compare the last three complete days with the average over the period you selected. Today is left out because it is not over yet. Sleep and other night-time findings use the last completed nights. Because the selected period is the reference, a longer period gives a more stable picture of what is usual for this client.
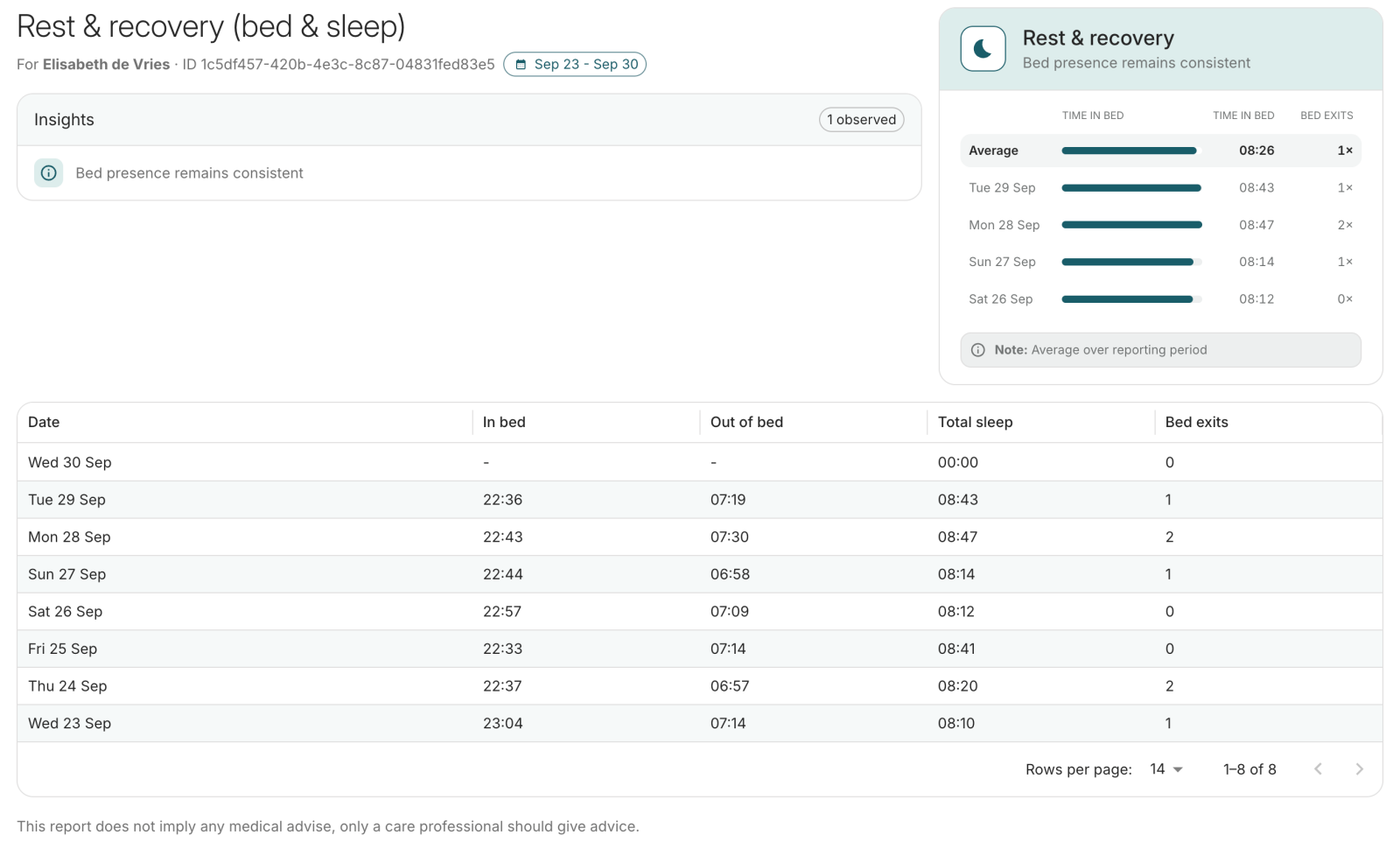
Click a block to open its details below the report. The details list every finding, not just the most important one, and show the data day by day, two weeks per page.
The six blocks
Rest & recovery
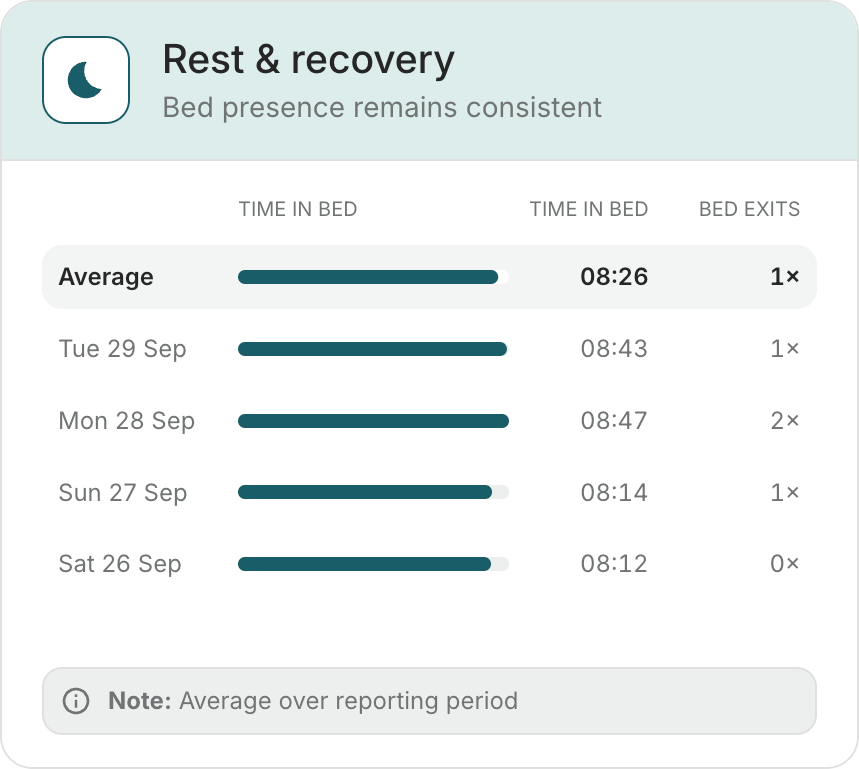
What it shows:
- when the client went to bed and got up,
- the time spent in bed,
- how often the client got out of bed during the night.
Where the data comes from: a Genus bed sensor. A bed exit is a moment the client left the bed during the night.
When it flags something:
- Less or more sleep than usual. The time in bed during the last nights is compared with the usual time in bed:
- Slight at 20% less or 30% more.
- Significant at 50% less or 75% more.
- Regardless of the usual pattern, less than 5 hours or more than 10 hours is slight, and less than 3 hours or more than 13 hours is significant.
- Getting out of bed at night more often. Bed exits between 22:00 and 06:00 are counted:
- Slight at 30% above the usual number.
- Significant at 75% above the usual number.
- For clients who rarely get up at night, the usual number is taken as at least two, so one extra visit to the toilet is not flagged.
Safety & alerts
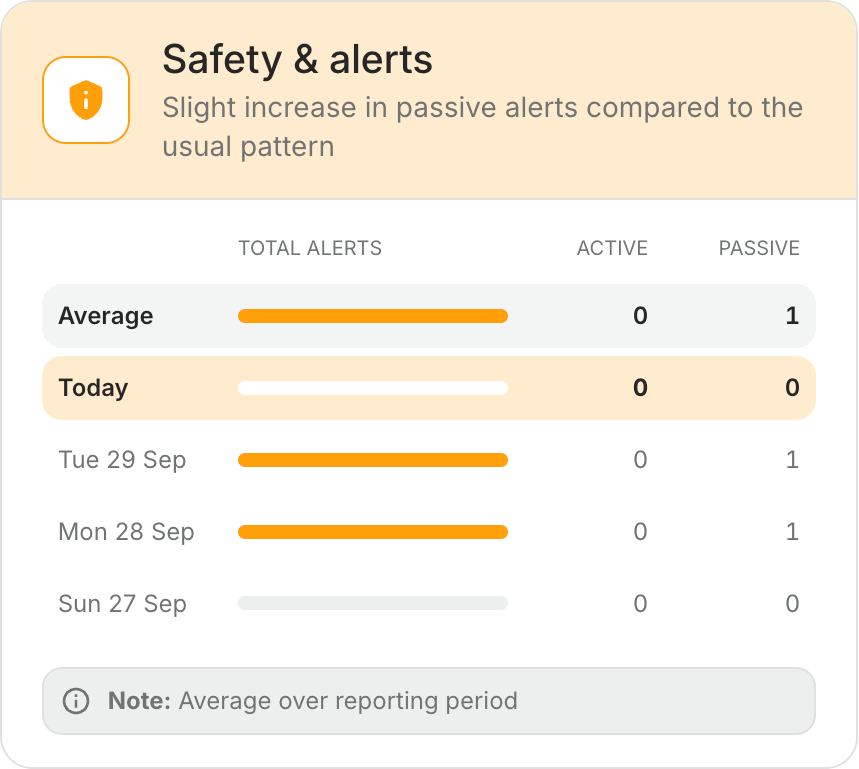
What it shows: the alerts raised for the client, per day and on average.
- Active alerts are alarms the client raised: the SOS button or watch, or the contact button on the Genus.
- Passive alerts are raised by the system, for example an unusual start of the day, or medicine that was not taken or not confirmed.
When it flags something:
- Red for any active alert in the last three days.
- Orange for any passive alert in the last three days.
Personal hygiene & toileting
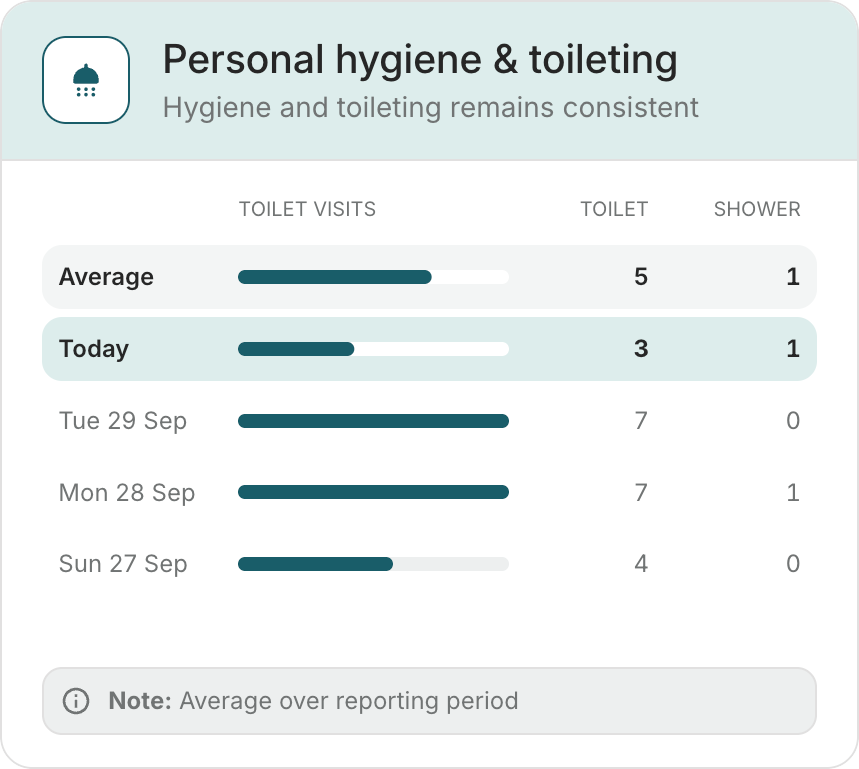
What it shows: toilet visits and showers per day.
Where the data comes from:
- a Genus movement sensor in the toilet,
- shower detection in the bathroom.
When it flags something:
- More toilet visits at night than usual. Visits between 22:00 and 06:00 are counted
- Slight at 30% above the usual number.
- Significant at 75% above the usual number.
- Here too the usual number is taken as at least two.
- No shower for five days or more. Orange.
Mobility & inactivity
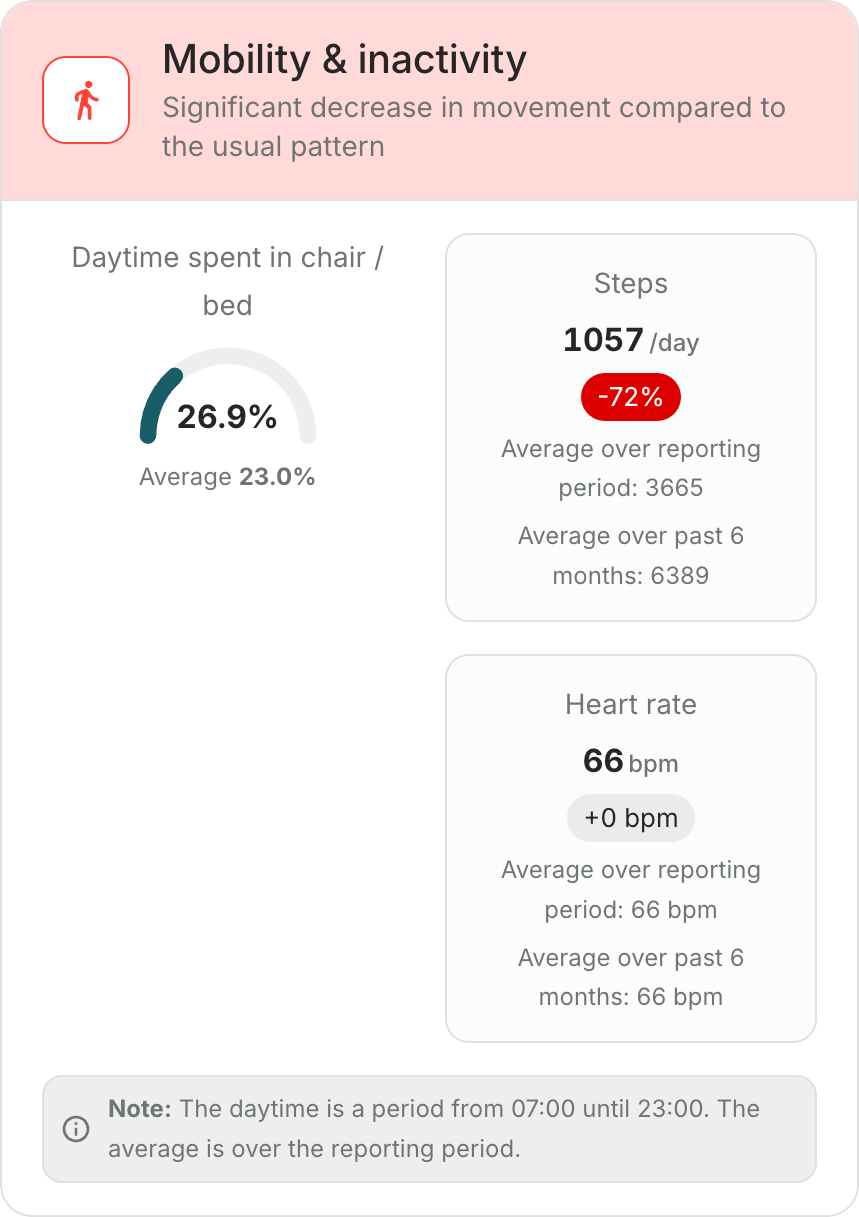
What it shows:
- Steps per day and heart rate, from a connected watch. The recent average is set against the average over the selected period and over the past six months, and the badge shows the difference.
- Time spent in a chair or in bed during the day (07:00–23:00), from Genus chair and bed sensors.
When it flags something:
- Fewer steps: slight at 30% fewer than usual, significant at 60% fewer.
- More time in a chair or in bed: slight at 20% more than usual, significant at 50% more.
- A different heart rate: slight at 10% above or below the usual rate, significant at 20%.
Nutrition & hydration
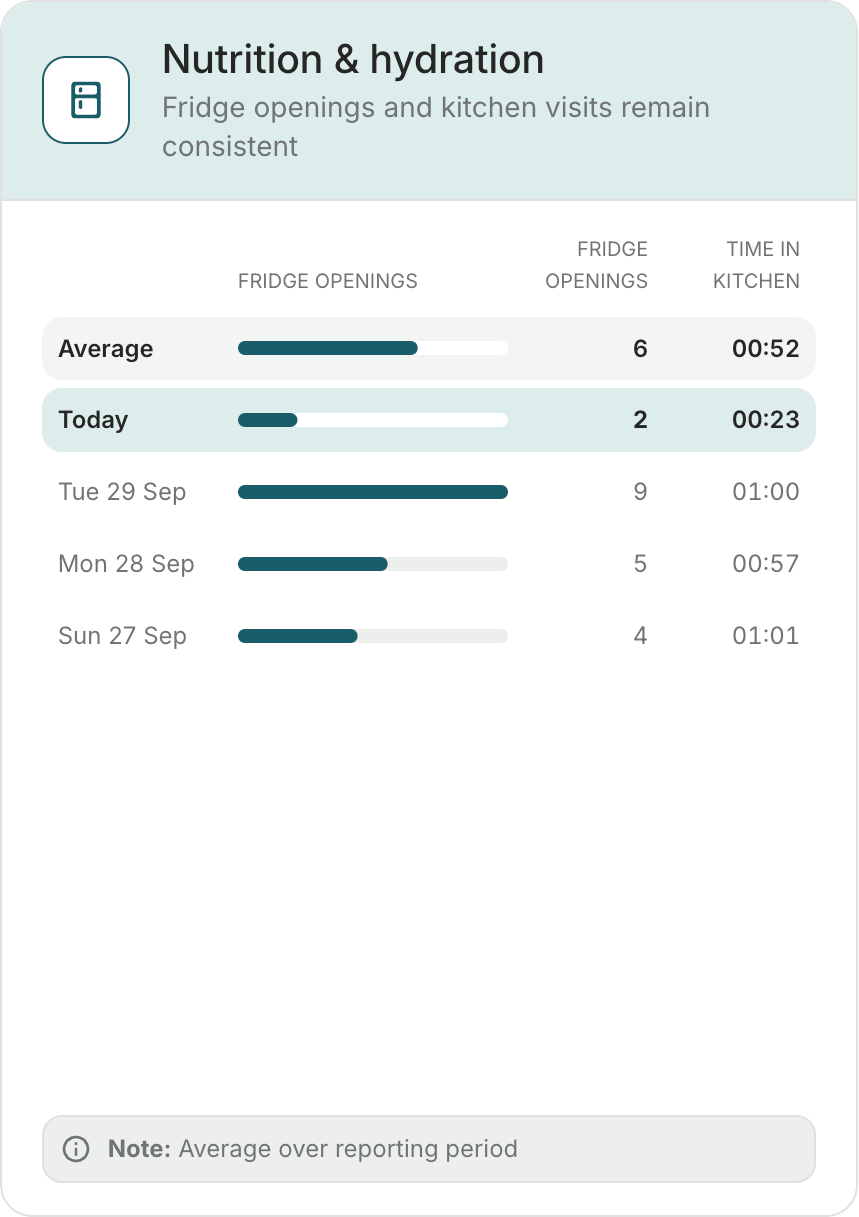
What it shows:
- how often the fridge was opened, per day and split into morning, afternoon and evening,
- the time spent in the kitchen.
Where the data comes from:
- a Genus door sensor on the fridge,
- a Genus movement sensor in the kitchen.
When it flags something:
- No fridge activity for two days or more. Red.
- Fridge openings 30% or more below the usual number. Orange.
The time in the kitchen is shown for context and does not raise findings of its own.
Social & comfortable living
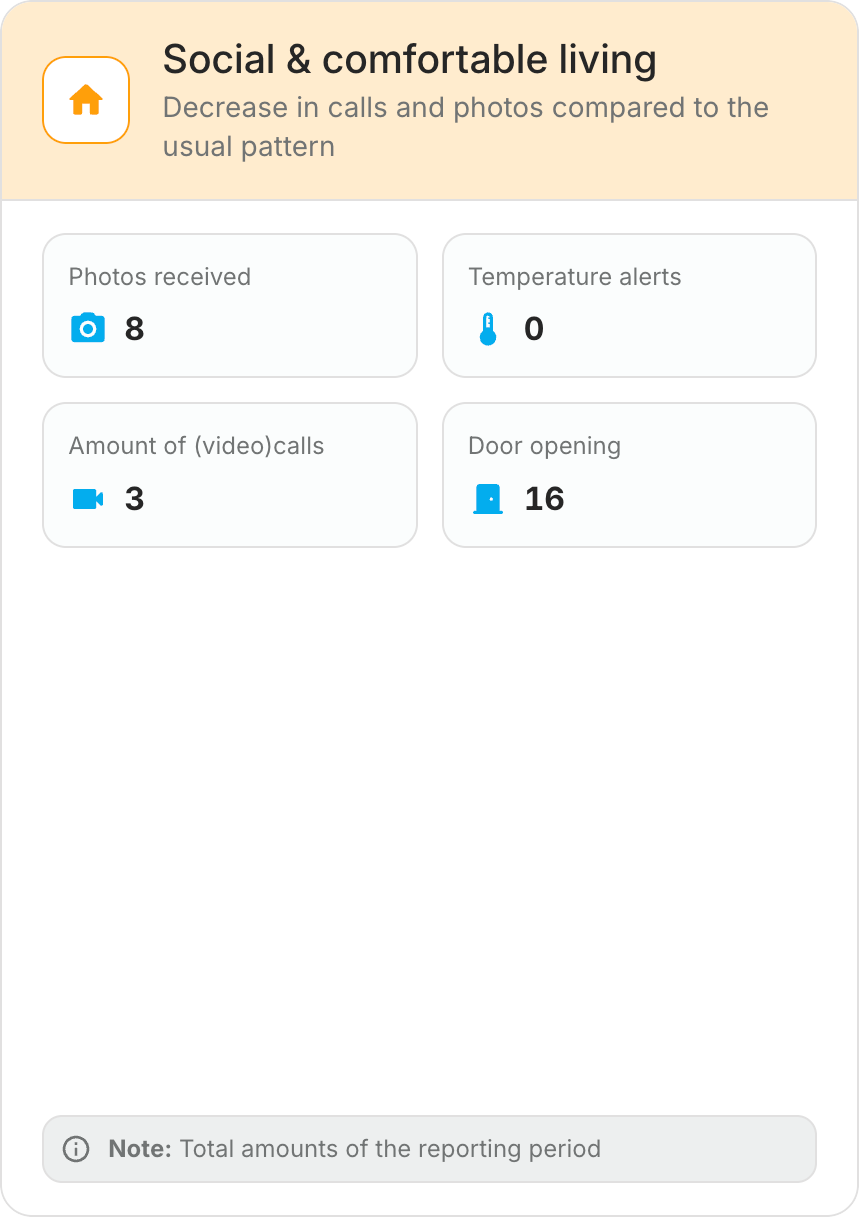
What it shows: totals for the selected period:
- photos received on the Genus,
- (video) calls,
- front door openings,
- temperature alerts.
The details add, per day:
- front door openings by day and by night,
- the number of connected family members,
- temperature, humidity and air quality measured by the Genus.
When it flags something:
- Fewer calls and photos: orange at 50% fewer than usual, red when none arrived at all in the last three days.
- Less front door activity: orange at 50% fewer openings than usual.
- A temperature alert in the home in the last four days: orange.
Example report
The example report shows every block with realistic sample data, calculated by the same rules as a real report. Use it
to explore the report before a client's own data is available, or to explain the report to colleagues.
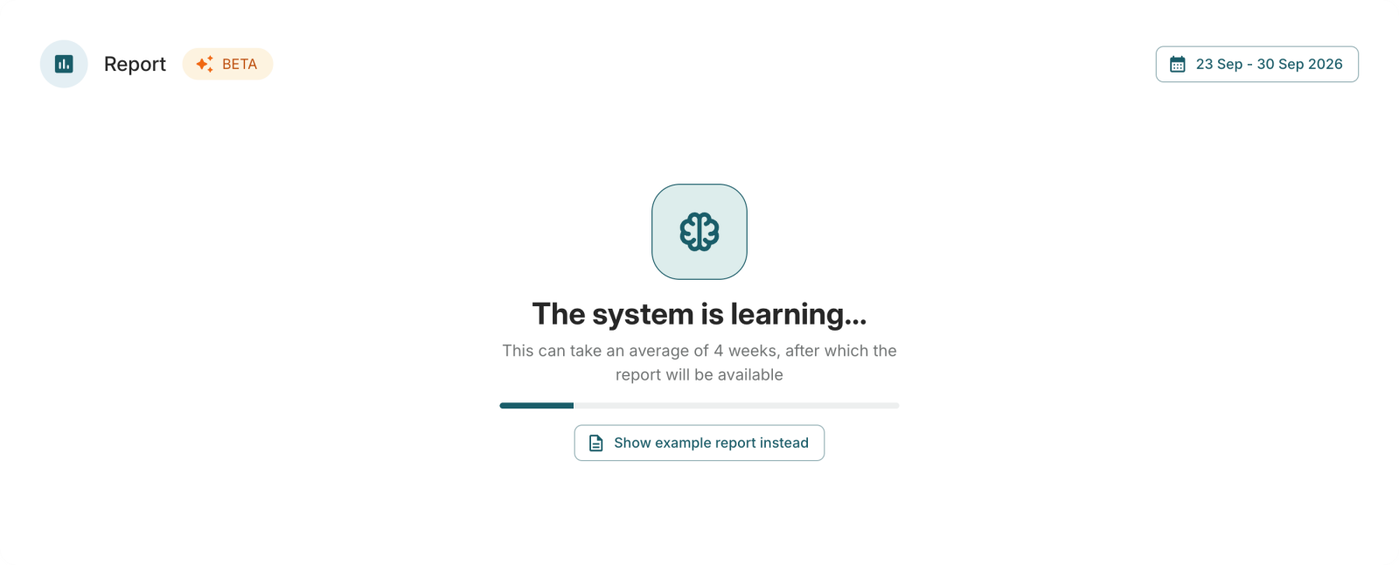
- For a new Genus, the report first shows The system is learning… with the button Show example report instead.
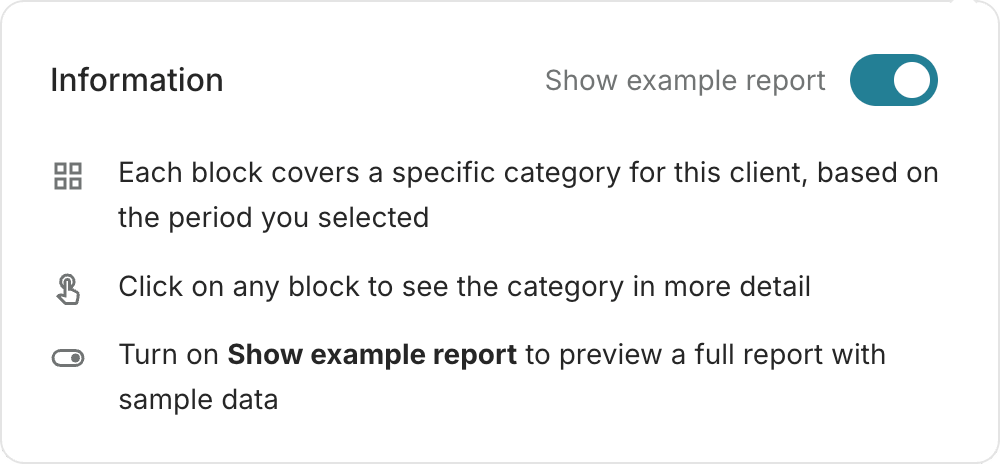
- At any time, turn on Show example report in the information panel (ⓘ).
While it is on, the report is marked Example report.
Printing
Use the print icon in the report, rather than the browser's print function. It produces an A4 document with:
- the overview of the six blocks,
- a page per block with its findings and every day of the selected period.
That makes the report easy to bring to a care meeting or a conversation with a general practitioner.
For integration partners
Reporting data is also available through a public API for integration partners, using an API token with the new Reporting permission. The API provides the underlying data, not the findings. The data covers:
- bed detections, visits, steps, routine events,
- calls, photos, notifications,
- environment measurements, sensors and clients.